Collections
Kyle Steven Habig created this post
@
on
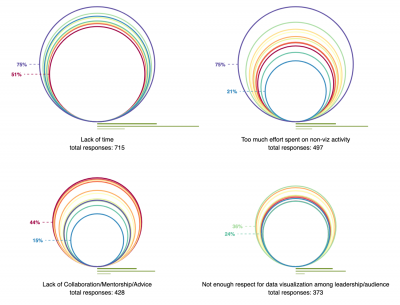
Comparison of percentages of respondents who have indicated a given job frustration grouped into years of different experience.
DVS Census 2020 Visualizations
Data Visualization Society 2020 Census Survey Visualization Challenge - Images of some of the winning images are saved here along with links to the entries.
Ann Bessenbacher
@
on

Selena Watson @ on
This is also a very good post which I really enjoyed reading. It is not every day that I have the possibility to see something like this. five nights at freddy's
Robert Wimmer @ on
The data illustrates the varying percentages of job frustrations among respondents based on their years of experience. Interestingly, those with less experience often encounter issues related to workplace dynamics and expectations. Much like the challenges faced in slope game , where each level represents different trials, workplace frustrations escalate as one navigates their career journey. Analyzing these frustrations can lead to better solutions and improved job satisfaction.
Crist Chris @ on
The survey highlights job frustrations among respondents, categorized by their years of experience. Interestingly, just as players navigate challenges in Friday Night Funkin , employees also face hurdles that intensify with experience. Understanding these frustrations can lead to better working environments.