Collections
Kyle Steven Habig created this post
@
on
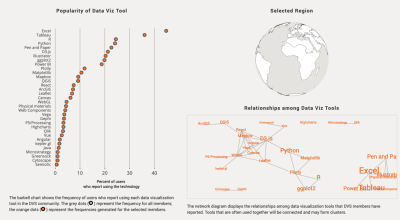
Usage of and Relationships among Data Visualization Tools
Chart and map of the usage and relationship of data visualization tools in different regions.
DVS Census 2020 Visualizations
Data Visualization Society 2020 Census Survey Visualization Challenge - Images of some of the winning images are saved here along with links to the entries.
Ann Bessenbacher
@
on

STEMExplorer Mind @ on
Data visualization tools enhance understanding and insights, enabling effective communication of complex data. Choose tools based on data types and objectives.
Career Explorista @ on
Data visualization tools facilitate insights from data through graphical representation, aiding better understanding and decision-making across various fields.