Collections
Kyle Steven Habig created this post
@
on
Graphs of percentage of respondents split into multiple groups
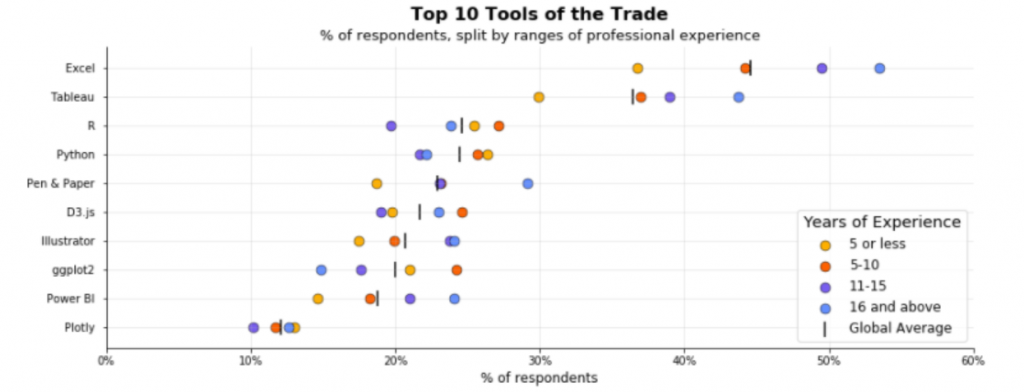
Graphs of how groups of different experience levels differ in software use, job frustrations, and more.
DVS Census 2020 Visualizations
Data Visualization Society 2020 Census Survey Visualization Challenge - Images of some of the winning images are saved here along with links to the entries.
Ann Bessenbacher
@
on