Collections
Ann Bessenbacher created this post
@
on
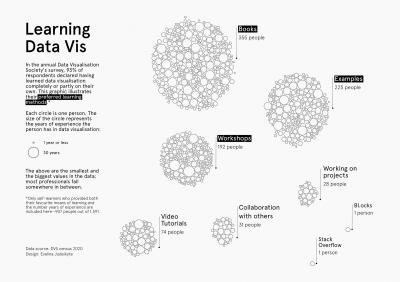
Learning Data Vis Circle Graphic
Graphic of circles to visualize ways people learn data visualizations.
DVS Census 2020 Visualizations
Data Visualization Society 2020 Census Survey Visualization Challenge - Images of some of the winning images are saved here along with links to the entries.
Ann Bessenbacher
@
on
